Data Insights
Software
Connect
Analyse
Take Decisions
Easy-to-use, open-source intelligence tool designed to help businesses make the most of their data.
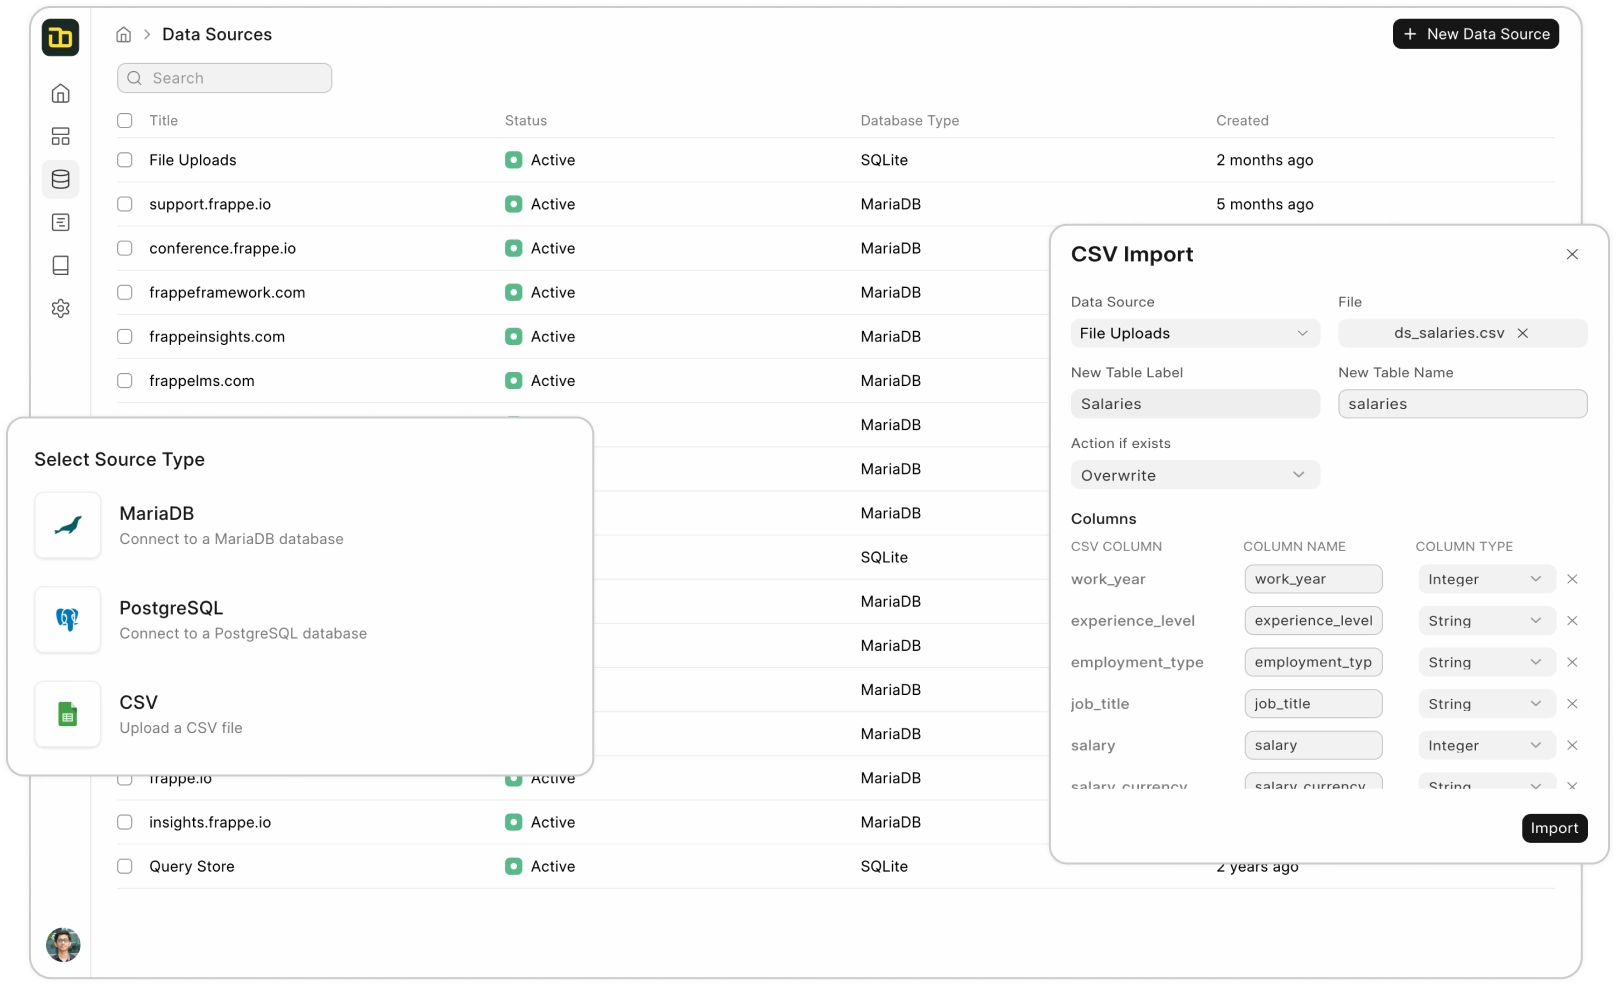
Connect to multiple sources
One major challenge organizations face in making data-driven decisions is managing scattered data. When data is dispersed across multiple systems, business analysts struggle to consolidate and analyze it effectively. Our data insight software simplifies this process by seamlessly connecting various data sources. Integrate data from spreadsheets, databases, and other sources, merge datasets, and create calculated columns for comprehensive analysis. By centralizing your data, our data insights software enables you to analyze interconnected information efficiently, develop reusable models, and streamline decision-making processes. Save time and effort while gaining valuable insights with our powerful data insight software.
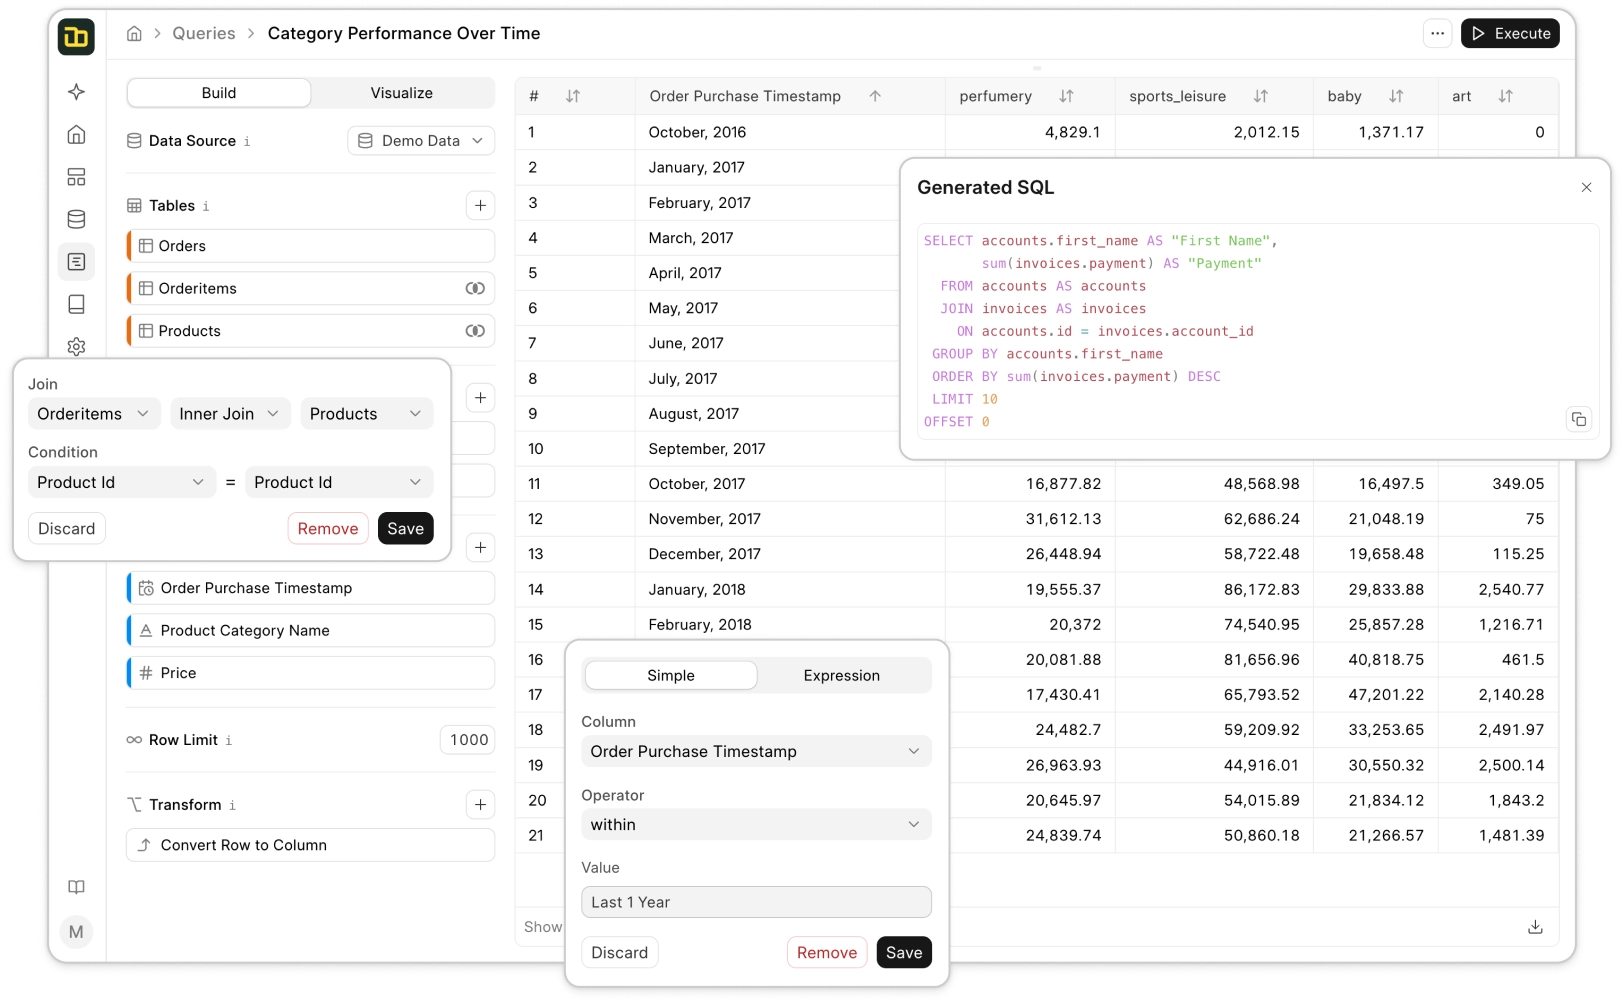
Build complex queries with ease
Data is most valuable when it drives actionable insights, and that's where Insights, a leading data insight software, excels. With its user-friendly query builder, you can effortlessly filter data to focus on what matters, select specific columns, and summarize information with built-in functions or custom formulas. It allows you to combine data from multiple sources for a comprehensive business overview, simplifying complex analysis through pivot tables and joins. Our data insights software empowers users to create reusable, auto-updating reports, enabling you to extract meaningful insights without heavy coding, saving you significant time and effort.
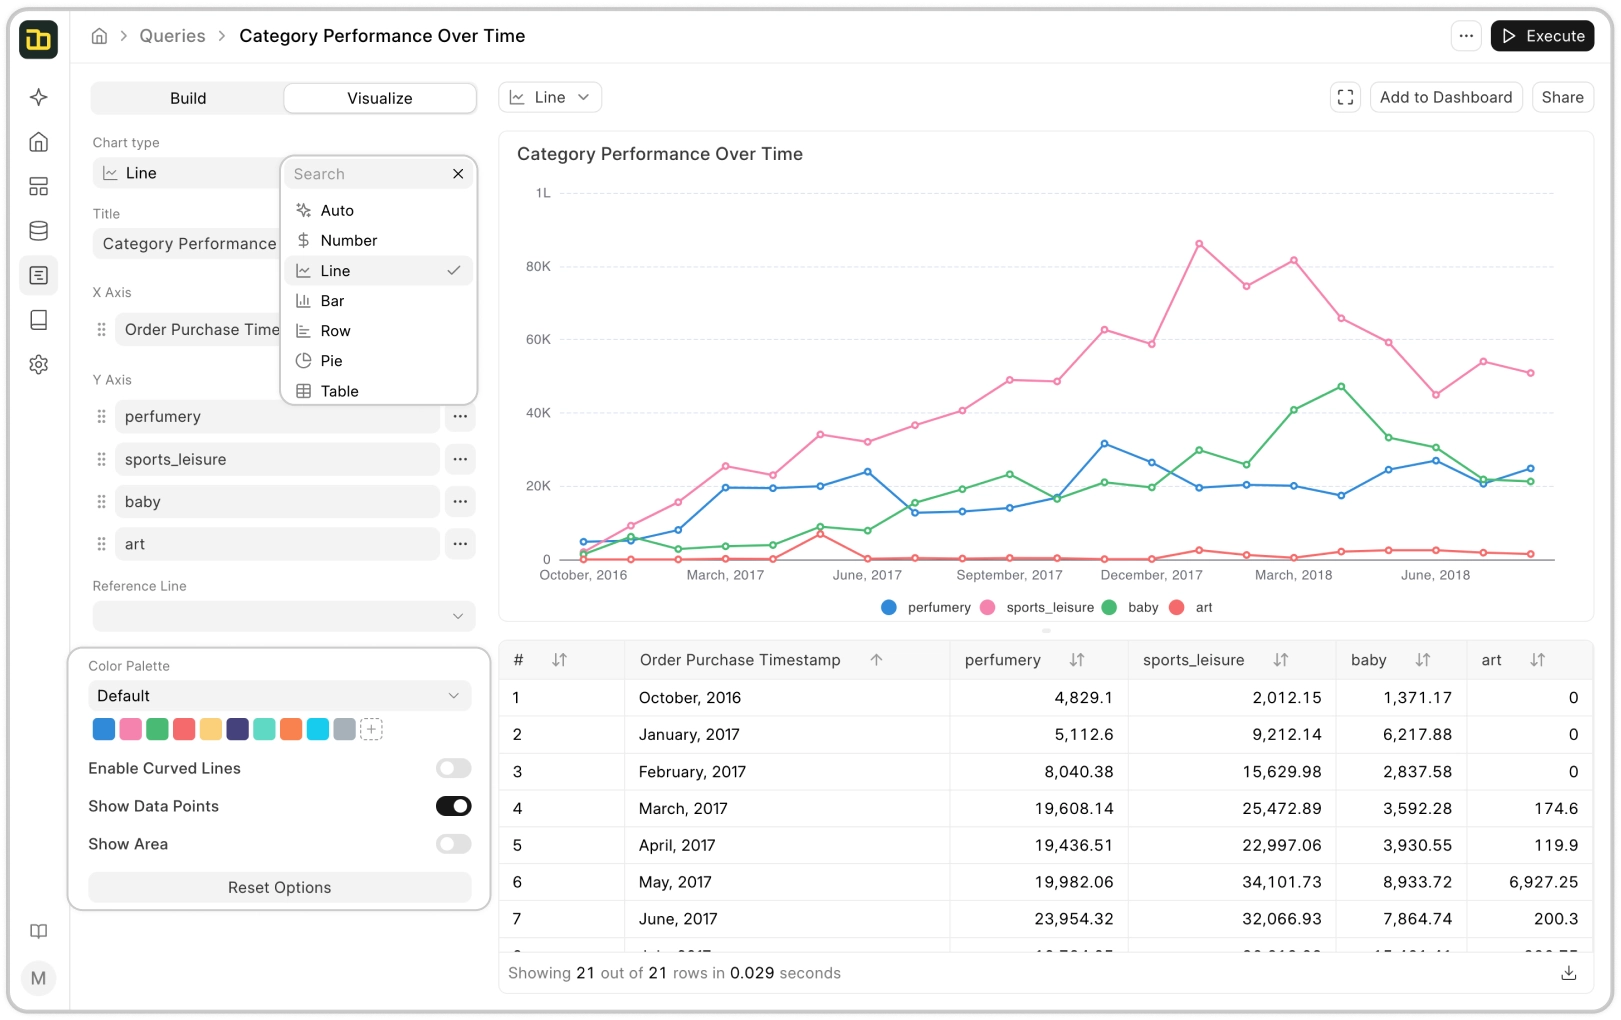
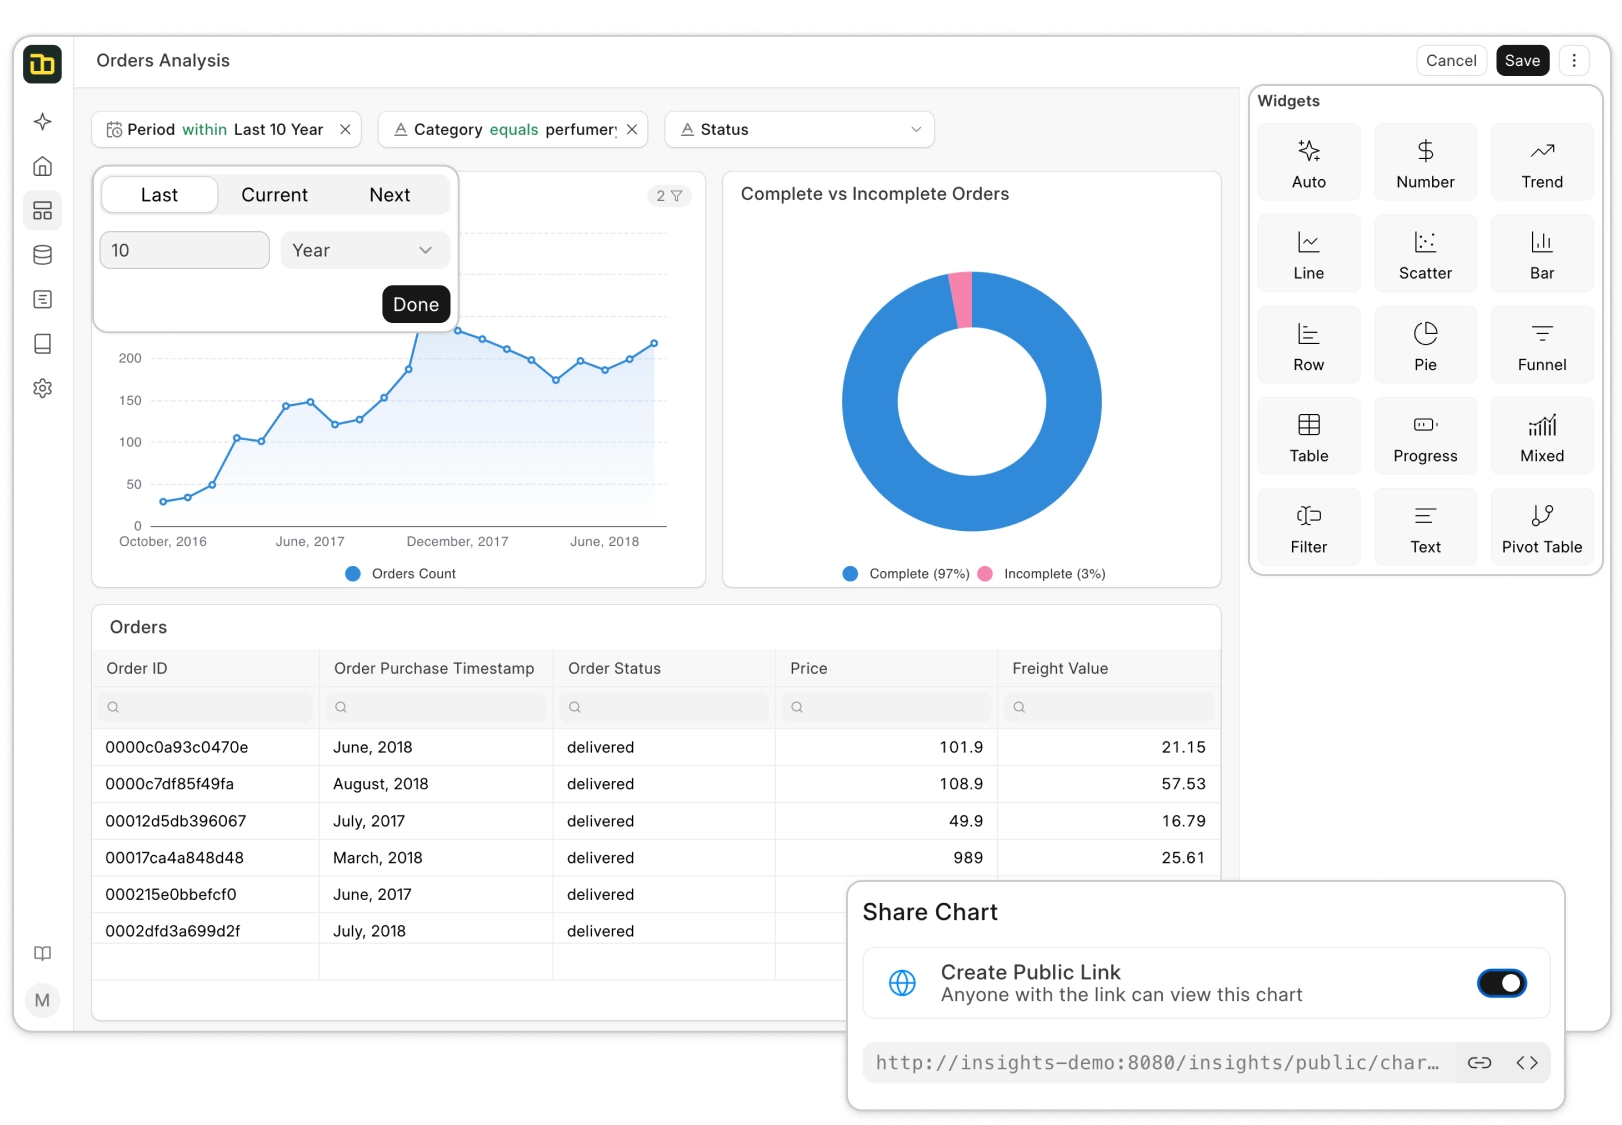
Analyse with insightful charts
Understanding data is best achieved through visualizations, and our data insights software, excels in this area with its robust visualization capabilities. Choosing the right chart to represent your data can be tricky, but data insights software makes it easy by suggesting the best chart for your data or letting you select from options like bar, pie, line, and trend charts. You can further customize these charts by choosing specific columns, adjusting colors and layouts, and adding reference lines and data points. Additionally, you can easily share charts, download snapshots, or integrate them into a dashboard for enhanced visualization.
Organise with powerful dashboards
Once your charts are finalized, you can organize them into dynamic dashboards within the data insights software, to monitor key metrics like outstanding payments, revenue, churn, and operations. Apply filters to focus on specific data, set up alerts for changes, and track progress over time. Insights also allows you to monitor real-time updates and dive deeper into data based on time or other dimensions. As your data models evolve, the data insights software automatically refreshes your visualizations, keeping insights current. You can easily share dashboards internally or externally, fostering collaboration and driving data-driven decisions across your organization.
Data
Insights
Software
Our data insight software is a user-friendly, open-source intelligence tool that empowers businesses to maximize their data potential. Designed for ease of use, it allows you to seamlessly connect multiple data sources, analyze them, and extract valuable insights. With these insights, businesses can make informed decisions that drive faster growth and improve operational efficiency. Whether you are aiming to boost productivity or enhance strategic planning, our data insight software provides the tools you need to unlock the full value of your data, ensuring smarter decision-making and sustainable business success.